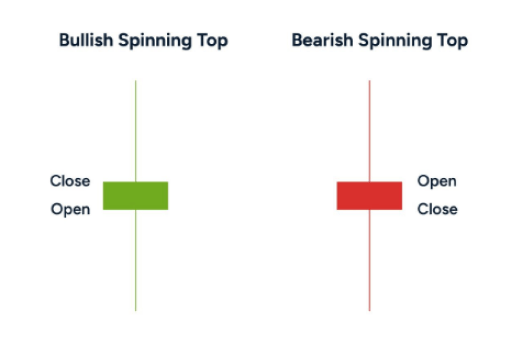
What are chart candle sticks?
A candlestick is a method used to visualize an asset's price movement. Candlestick charts are widely favoured in technical analysis, allowing traders to swiftly interpret price data with just a few price bars.

Why do we use candle sticks?
Candlestick charts provide a more detailed perspective of price action, with each candlestick representing the open, high, low, and close prices for a given time period. Traders frequently use candlestick patterns to spot potential market reversals or continuation trends.
Line charts limit the amount of visually available data. Using candle sticks alone are enough for some strategies if trading through pure price action.
Final thoughts
Candle sticks are really simple to understand. After reading the above, you should now be ready to start reading the charts and start understanding the price and how it is moving. Don't forget, when you're on a chart, the timeframe you select will be how much time was taken for the candle to form. For example, a 15 minute chart with take 15 minutes for each candle to form. This allows you to see the lows, highs and direction of that bar within that timeframe.